Infographic Design Strategy
To protect the IP of my previous employer, Broadcat LLC, copyrighted designs are displayed with their permission for the purpose of sharing my professional design experience. They are not permitted for any other use. Any other image examples listed are credited to the original creator or source.
No matter the industry you work in, you probably interact with infographics. They are so popular because they help us digest information quickly and their imagery can even help us better remember information, because our brains respond so well to pictures.
But there’s more to designing them than just putting a bunch of pictures (or numbers) next to words. Similar to the quantitative infographics, qualitative infographics each serve different purposes depending on the message you want to convey. I’ve worked most commonly with checklists, flowcharts, and contrasting examples.
So, how do you choose the best format for your content and get the message across clearly? Here are a few tips from my B2B experience and observations in the wild—I’ll detail the scenarios that lead me to choose each format, and some design constraints I follow.
Basic infographics
Use this if you’re introducing a high-level summary of a concept or process

Example: 2022. CDC posters promoting hygienic practice in office building.

Example: 2016. INPES poster promoting hygienic practice in Paris public transport.
I don’t have a better name for this first category than “Infographics” because they really are the most pure form of an infographic. These are the most adaptable to work with because they’re basically any combination of graphics, illustrations, words. You might see them in a textbook, in an email, or posted on a wall or piece of equipment as a notice.

The imagery used can attract attention from your audience in urgent or changing environments, and it can also help trigger the memory of a reader who’s just learned something new.
If the content becomes more specific or granular, that’s when I’ll start to look at what other formats I can use to communicate my message.
Rules I follow when designing infographics
Choose a heading that tells the reader how this subject applies to them
Divide the content into no more than 3-5 categories
Use graphics and color to help support your layout structure or grid
Keep sentences or phrases short (30-40 characters)
Pair phrases or headings with images that closely represent the info
Guide the eye down the page for a process by using numbers or arrows
Checklists
Use this if you want to improve a high-stakes process
Example: Pilots reading a Boeing checklist in real time.
Once you start making checklists, it’s tempting to make one for EVERY SINGLE PROCESS. I’m guilty of this—it feels so rewarding to check items off! But if they’re not used strategically, they can potentially overshadow the task at hand. Checklists are best for routine processes that have a lot of room for mistakes. A lot of experts (like surgeons and pilots) work these into their risky processes as sort of an extension of their memory so they can focus on the full picture without having to remember every small, but potentially life-saving step.
Although we may not always think of checklists as infographics, I would argue that they are. While I like to use restraint in the number of images or illustrations included, there are ways to incorporate them subtly that can support the visual flow and readability. But a checklist doesn’t even have to be colorful or have spot illustrations to be considered an infographic. The checkboxes themselves do a lot of visual work!

Used in the right context, the boxes signal to your reader how they should interact with the information you are presenting them.
Depending on your content, you can transform a bulleted list to a checklist and easily make your message more practical.
Rules I follow when designing checklists
Establish repeating patterns to guide the reader’s eye:
Use icons along with headings to make it easy to scan
Follow a consistent sentence structure
Make list items similar in length
Include a similar number of list items/nesting in sections
Confirm the list items in each section:
Are framed similarly (e.g., either positively or negatively)
Can be completed within a reasonable window of time
Provide enough context to understand when they’re complete
Contrasting examples
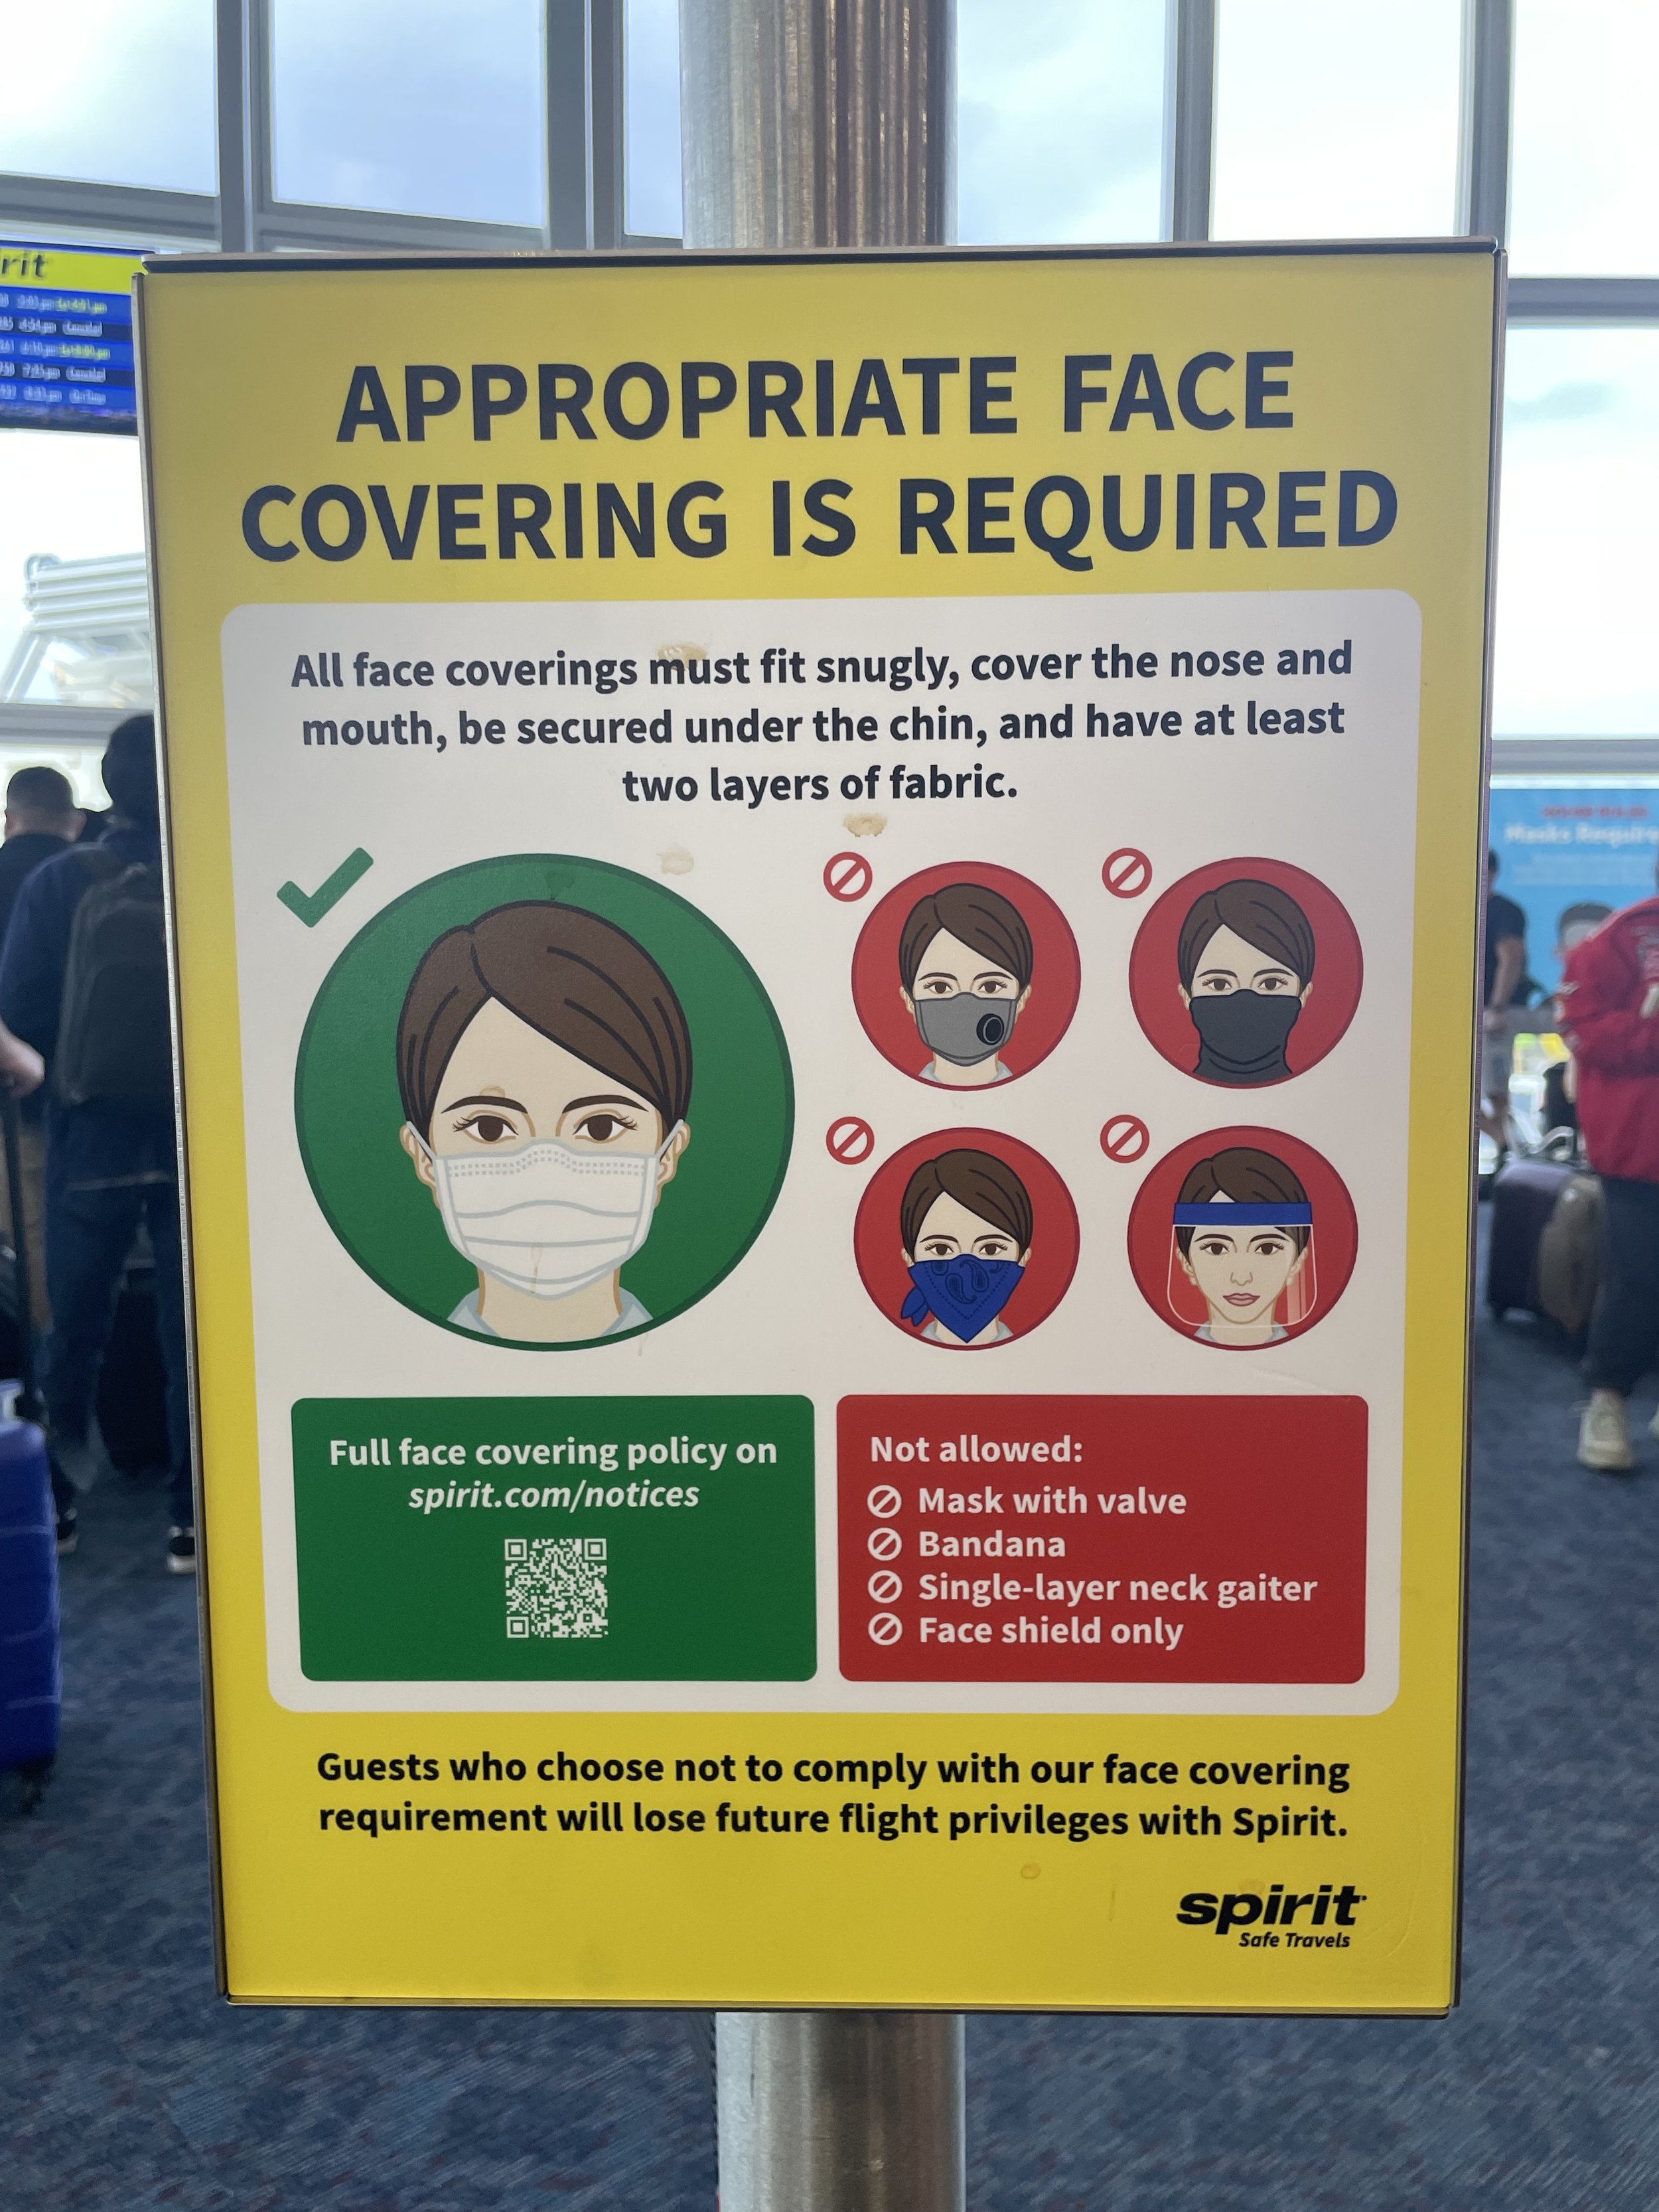
Example: 2022. How to (and how not to) use a face covering in Las Vegas airport.
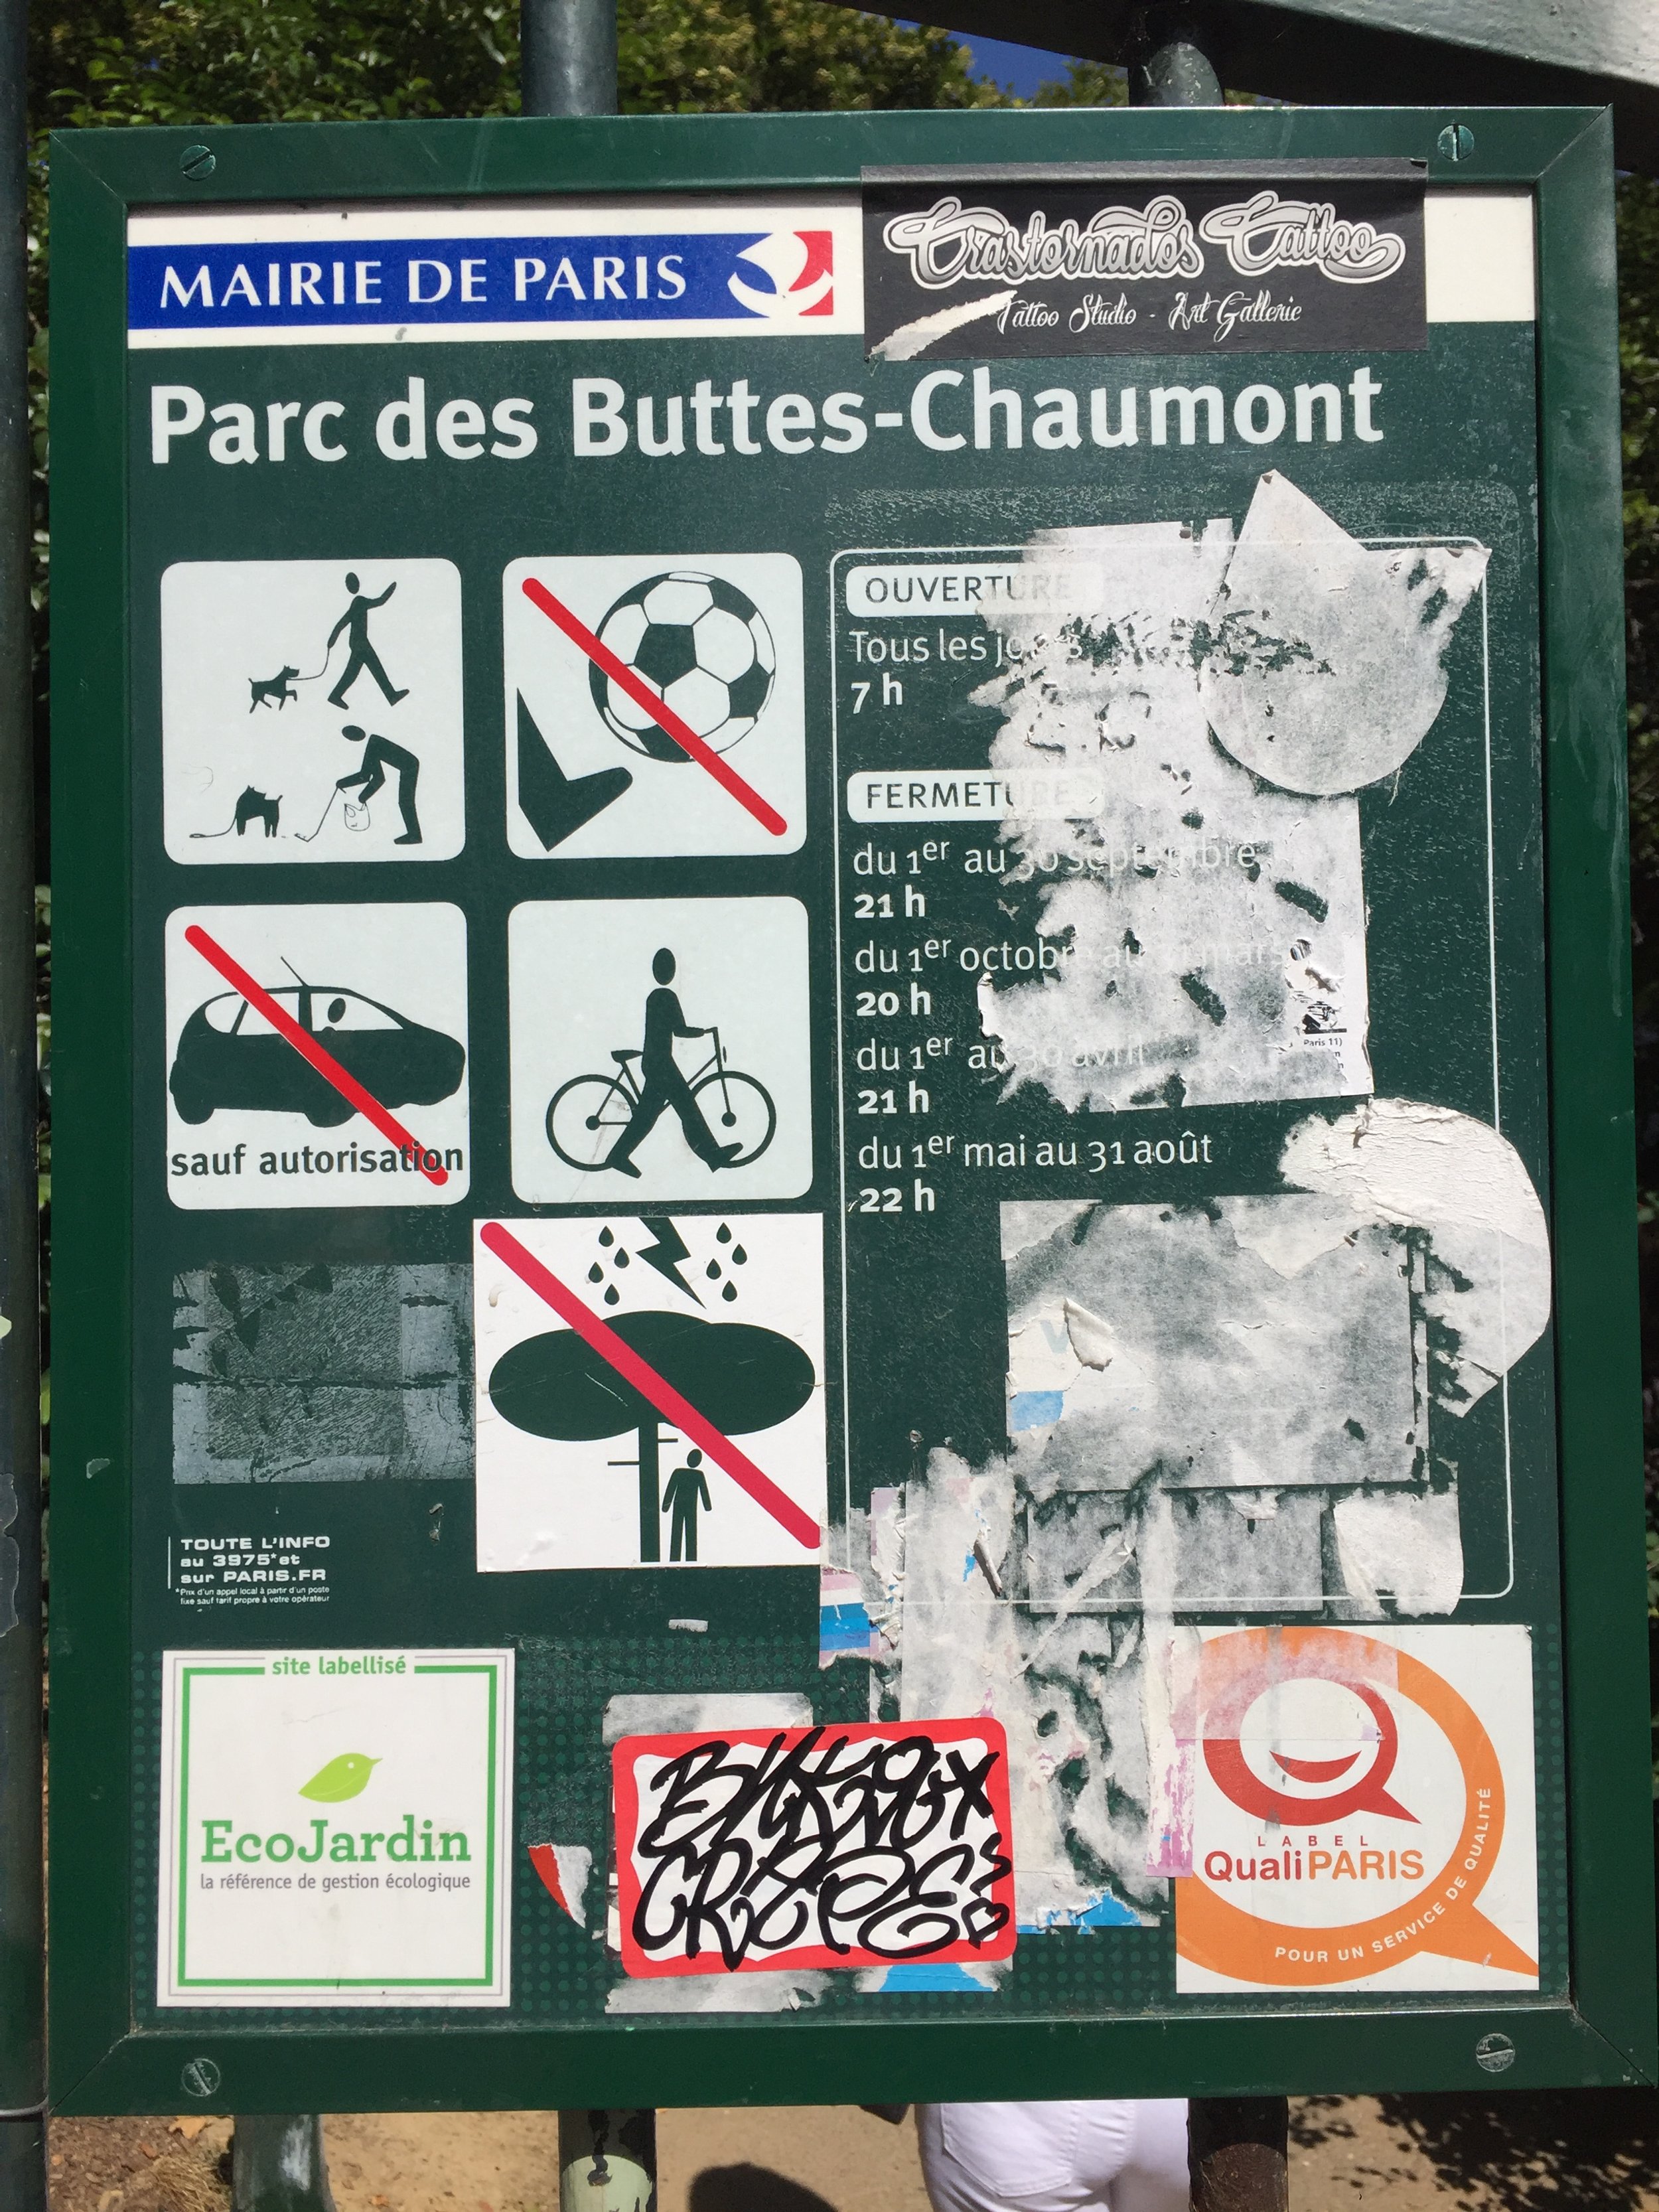
Example: 2017. Appropriate and inappropriate activities in a Paris park.
Use this if you want to improve a process that’s not intuitive
This format is powerful because it does a lot of invisible work. If executed well, it can provide context to an ambiguous decision without the reader even realizing that’s what is happening. You might see this type of format on instructions for how to operate machinery, or you might see it on the walls of kindergarten classrooms teaching kids about behavior.

Showing opposite ends of the spectrum for each step of a technical process where a person’s judgment is exercised can help clear up any confusion that might disrupt that process.
And, when using contrasting examples for behavioral decisions, you can potentially bring to light unconscious biases that may keep the reader from seeing the alternate impact of their actions.
Rules I follow when designing contrasting examples
Keep line items similar in length
Make sure one contrasting pair isn’t more obvious than the other
Make sure one contrasting pair isn’t more specific than the other
Use color to support your tone (e.g., green as positive, red as negative)
Use spot illustrations only if they accurately represent the content
Flowcharts

Example: 2016. French government poster outside of Picasso Museum explaining what to do in case of an attack.
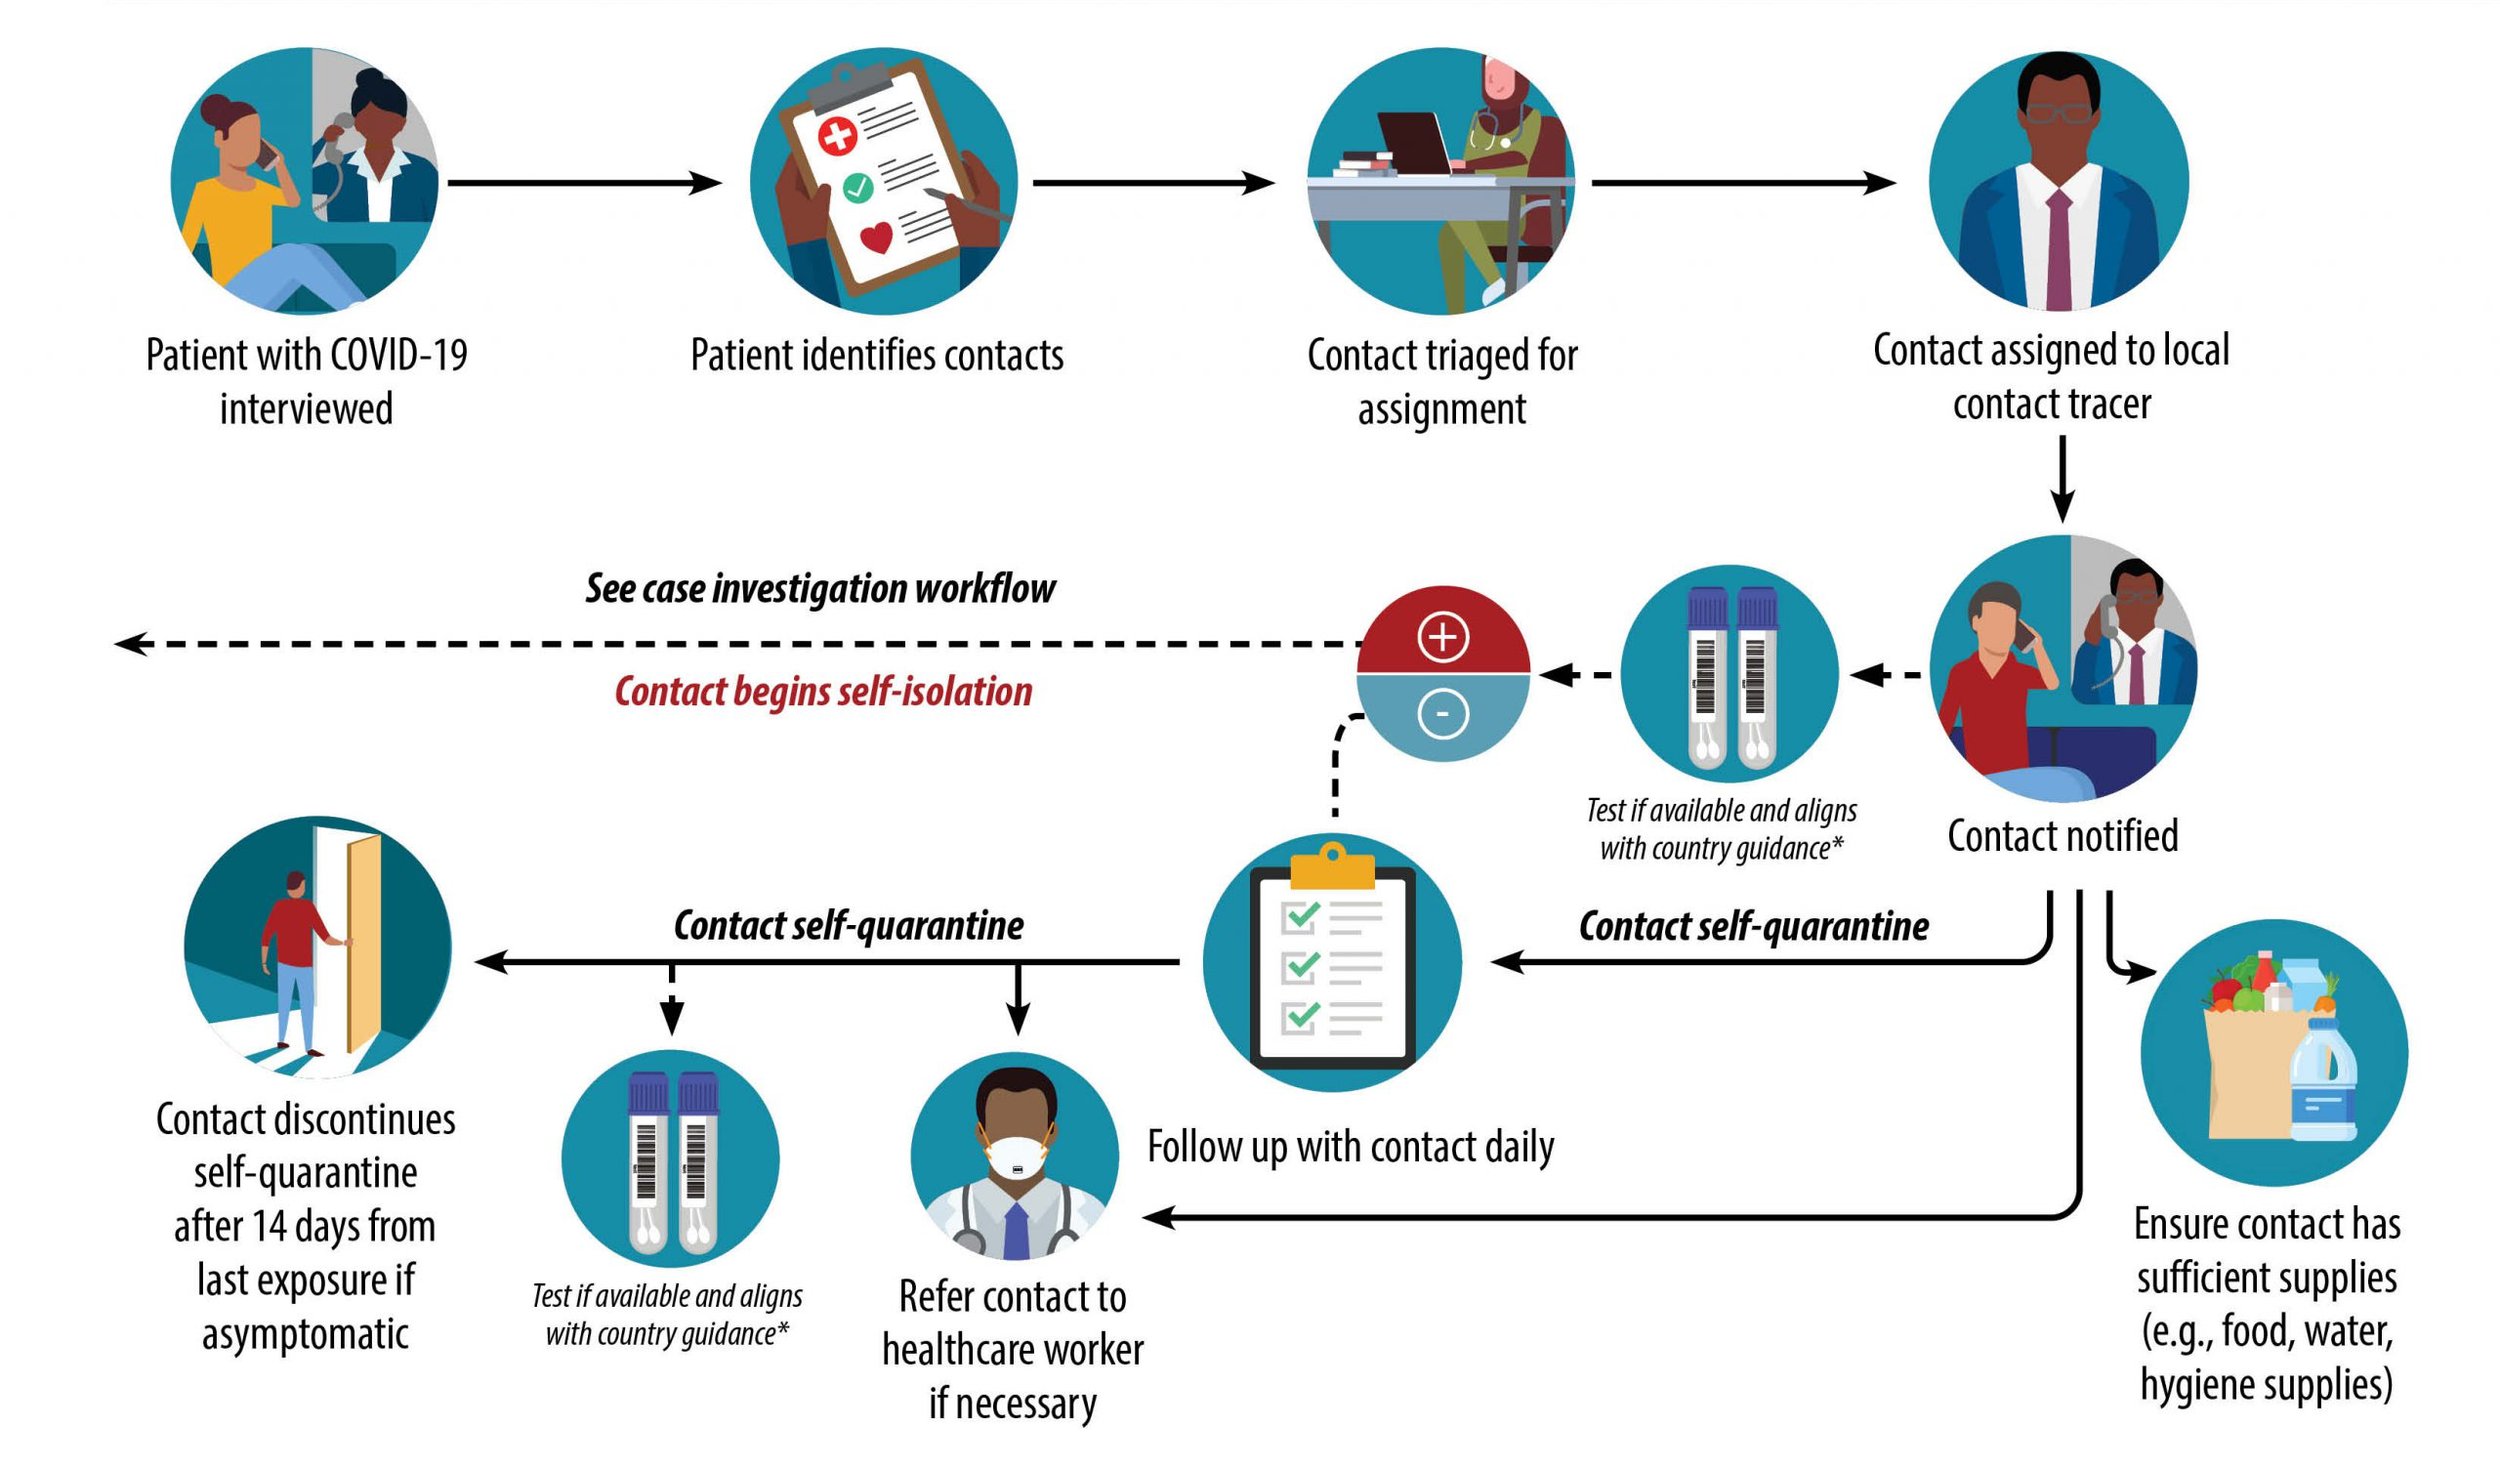
Example: 2022. CDC workflow for healthcare workers doing contact tracing.
Use this if you’re guiding people through decision-making
These are the hardest (and my favorite) to design. Similar to checklists, I believe they are often misused. We’ve all seen the convoluted flowcharts that you have to read at least 10 times just to get to the first conclusion. To be clear, I don’t want to discredit complex flowcharts altogether. They can be used for entertainment (I’m one of those people who watched over 5 hours of Bandersnatch just to see all the different paths it took). Outside of entertainment, complex flowcharts can be used to illustrate a point, like this flowchart that visually shows how difficult it is to find a path to citizenship in the U.S.
But I want to speak primarily on the use of flowcharts that will be used to improve a workflow. If not everyone in your audience needs to see the full process, consider breaking the information down for one audience. If your audience needs to stop reading the flowchart just to answer any of the questions in your flowchart, there’s probably a better format for your infographic.

I approach flowcharts as an exercise in UX design, because you have to put yourself in the shoes of the audience and consider what they know, what their goal is, and how that will affect the way they interact with the information presented.
Rules I follow when designing flowcharts
First, know when not to make a flowchart:
If you have multiple audiences with different roles, divide your content into an infographic for each role (they might even be two different formats!)
If the audience can’t answer the questions with a clear “yes or no”, try contrasting examples instead, and you can specify the yes and no for them
If each question leads to a nuanced outcome, create a table chart instead, with all the possible outcomes along one axis
If a flowchart is the right format for your content:
Group questions that lead to similar outcomes for an easier flow out of the chart
Order by leading with the questions that lead you out of the flowchart quickest
Frame questions positively where possible (avoid double-negatives)
Follow a consistent sentence structure in all your questions to make it easier to scan
Place all the “yes” answers on the same side instead of switching back and forth
Find the simplest path for your last arrow, and frame the other arrows around it
Try to keep all the arrows flowing in the same or similar direction
Make your conclusions easily identifiable by styling and placing them similarly
Remember the original goal
It’s easy to get lost in the layout sauce and forget what the original message was meant to do, so remember to zoom out and reference your purpose when designing. It’s also OK to break your own rules if they start to work against your goal.
In 2015, I designed my first infographic while interning at an agency in Dallas. It was a quantitative infographic that summarized a survey on Millennials. Today, I work at Broadcat, a compliance design company that creates materials for companies to use in their in-house compliance training. In 5 years, I've gathered a diverse experience designing over 100 qualitative infographics that help people understand how to do their jobs ethically and compliantly. The subjects covered can range from corruption to harassment, and each design calls for a certain format, and a unique solution.
I’m speaking from my own personal experience, but there is no cookie-cutter way to design anything. All of these formats are going to require or allow for different rules, depending on your message. I’ve slowly gathered these are practices while working on a small team of talented designers, but I don’t think these rules are by any means final. You and your team surely have your own style and go-to practices that work best for you! I want to hear about them. Do you also follow any of these rules? What do you do differently?